Author: Nako

How to embed tweet button in WordPress article

GOAL

To embed Tweet button in each WordPress articles.

Environment

WordPress 5.2.5

Method

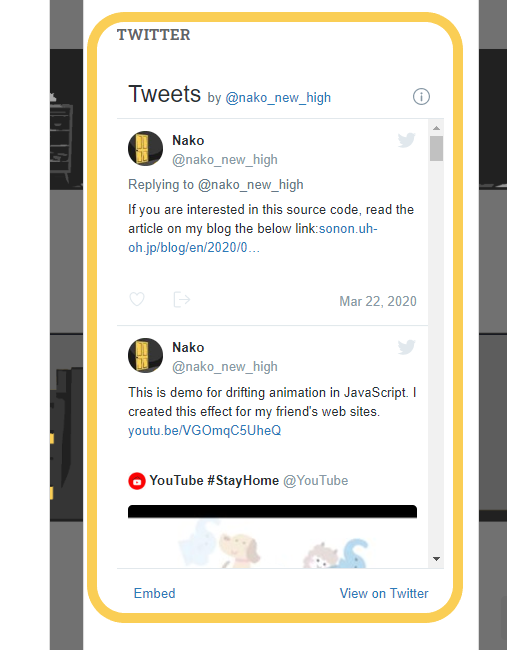
1. Get the source code of Tweet button.

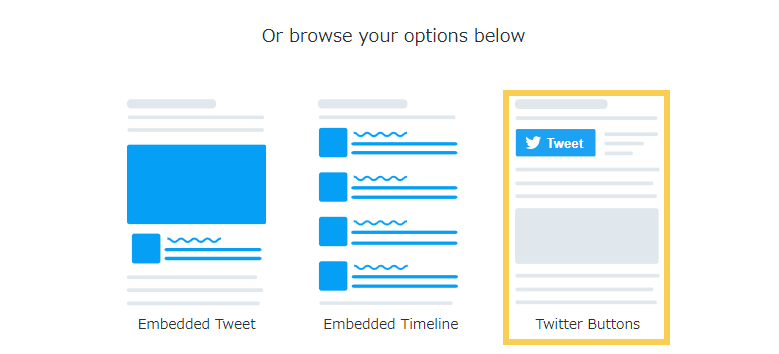
Get the source code of tweet button from https://publish.twitter.com/#

Select “Twitter Buttons”.

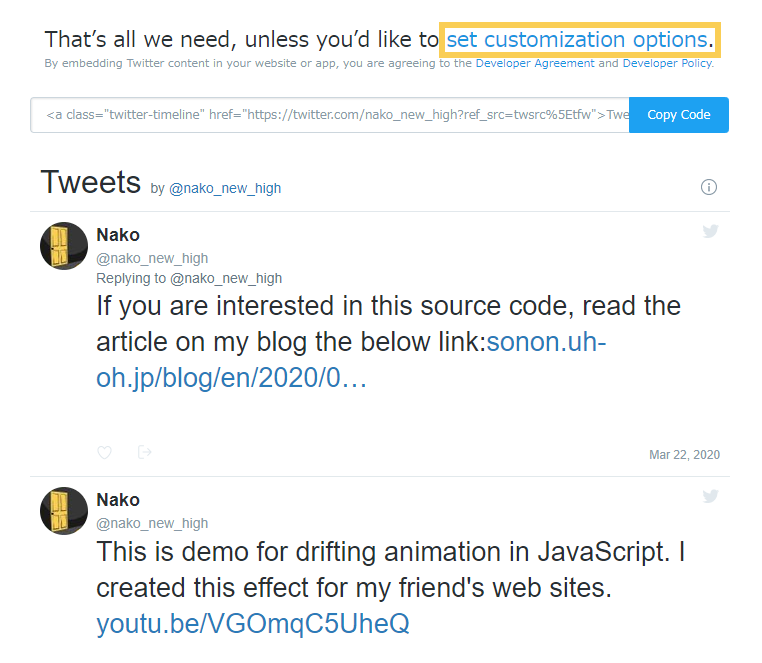
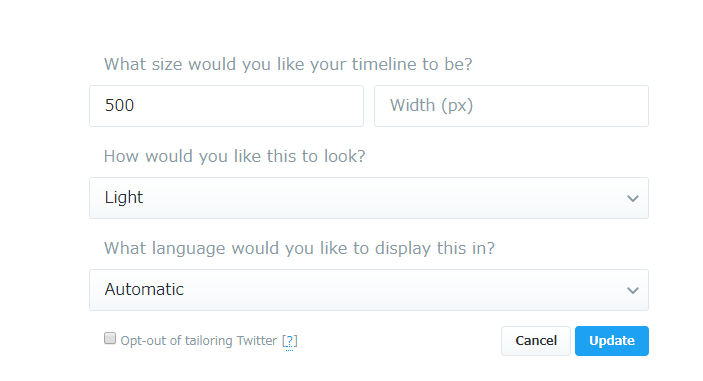
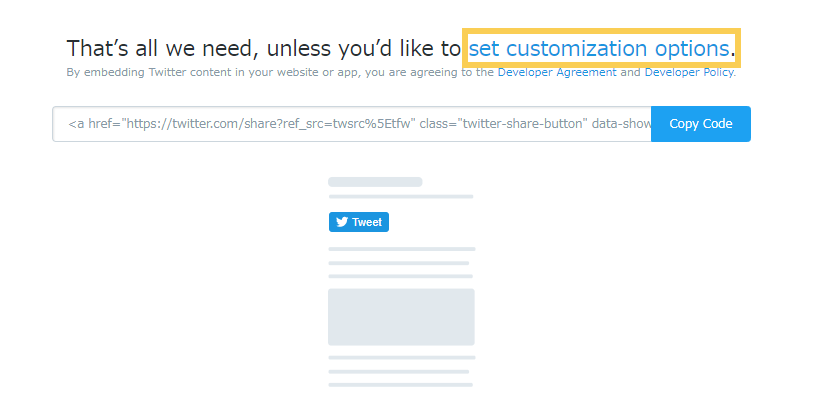
Customize the style of tweet button and copy the code displayed.

from https://publish.twitter.com/

2. Embed the source code.

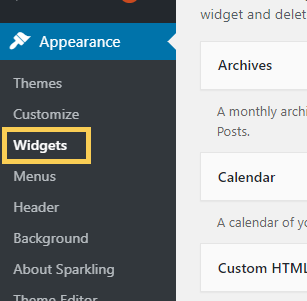
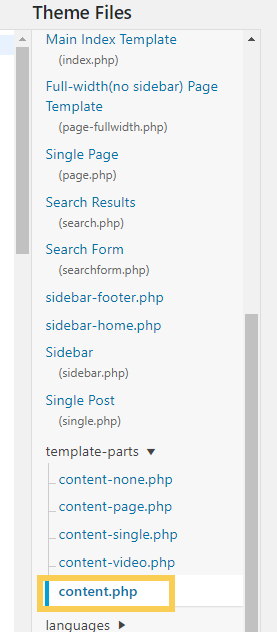
Click the Theme Editor on your WordPress Dashboard. And open content.php.

Put the code copied from https://publish.twitter.com/ on any place you want.

<h2 class="entry-title"><a href="<?php the_permalink(); ?>" rel="bookmark"><?php the_title(); ?></a></h2>

<a href="https://twitter.com/share?ref_src=twsrc%5Etfw" class="twitter-share-button" data-via="nako_new_high" data-show-count="false">Tweet</a><script async src="https://platform.twitter.com/widgets.js" charset="utf-8"></script>

Then change the code to get the target source URL and the title.

<a href="https://twitter.com/share" data-url="<?php the_permalink(); ?>" data-text="<?php echo get_the_title(); ?>" class="twitter-share-button" data-via="nako_new_high" data-show-count="false">Tweet</a><script async src="https://platform.twitter.com/widgets.js" charset="utf-8"></script>

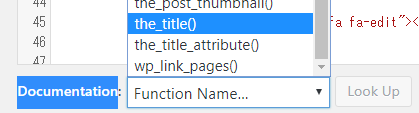
php funtions to get information of the article can be searched by Documentation.

Put the link and add php functions in content-single.php and content-page.php.

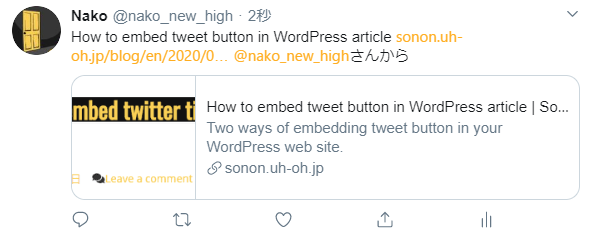
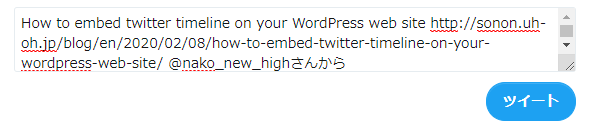
3. Check the Tweet button.

4. Create Tweet card with

Install All in One SEO on your WordPress.

Open All in One SEO > Feature Manager

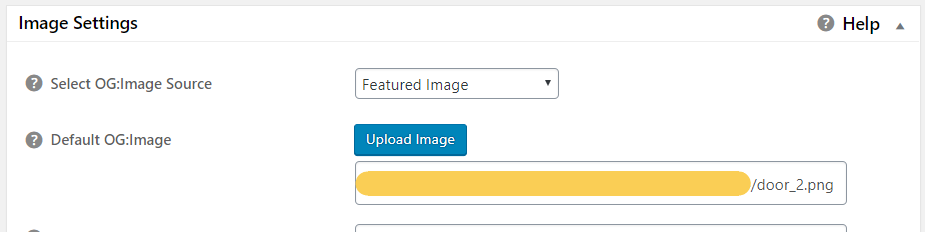
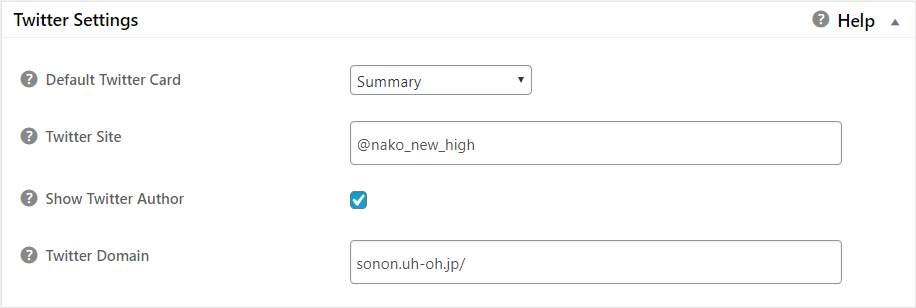
Activate “Social Meta” and open the page of Social Meta. Input information about thumbnail image and your twitter account.

Access the Card validator and check your card preview.

5.

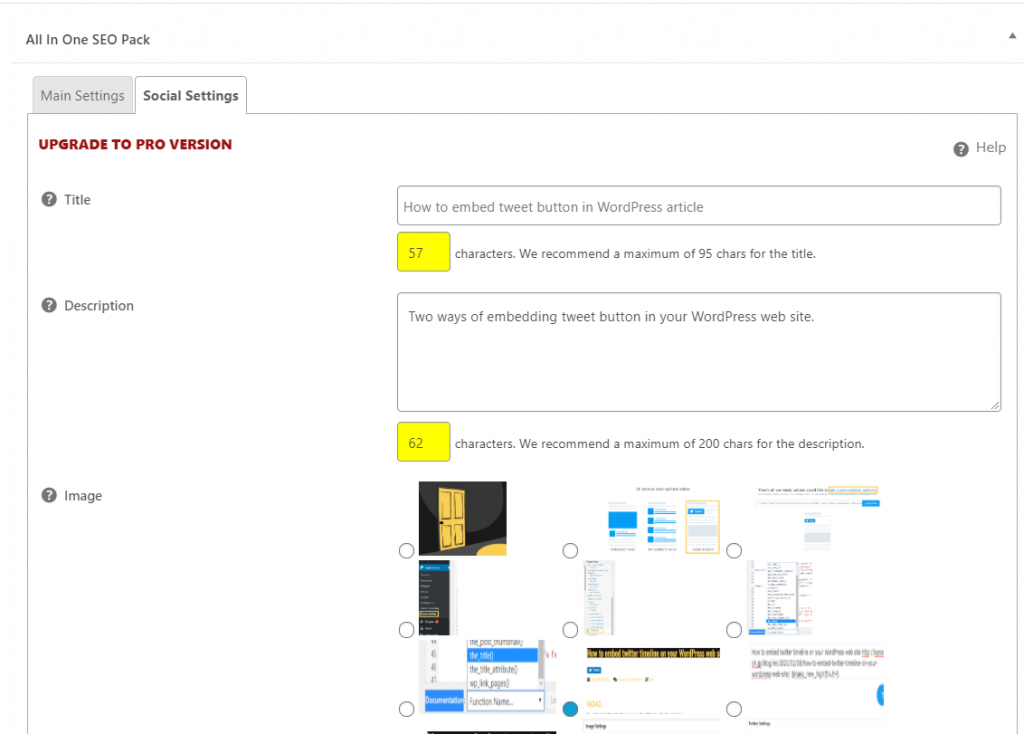
When you add new post, input information about the article and select thumbnail image in Social Setting Area of All In One SEO Pack.

Result

How to embed twitter timeline on your WordPress web site

GOAL

To embed twitter timeline on your WordPress web site as below.

Method

Access https://publish.twitter.com/#

And input URL of your twitter home.

from https://publish.twitter.com/

Choose one of the two styles. If you want to change the size, looking or language of this area, click “set customization options”.

Change the style and click “Update” button.

Copy code.

Open your WordPress Dashboard and click Appearance>Widgets.

Create Text widget and put it into any space you like.

Paste the code copied from https://publish.twitter.com/ and save the widget.

[JavaScript] Two Types Of Canvas Size.

GOAL

To understand canvas size, canvas.width and canvas.height, and how to set the size.

2 types of canvas size.

  • width and height set by css that determine the size of canvas element relative to the window size
  • canvas.width and canvas.height are reference values that determine the criteria for the image to display

These two sizes have separate meanings and are set independently.

What is the difference between canvas.width and canvas.height?

<style type="text/css">
    #canvas-container{
        width: 800px;
        height: 500px;
        border: solid 2px;
    }
</style>
<div id="canvas-area">
    <canvas id="canvas-container" width=800 height=500></canvas>
</div>

Change the canvas element size (display size).

<style type="text/css">
    #canvas-container{
        width: 400px;
        height: 400px;
        border: solid 2px;
    }
</style>
<div id="canvas-area">
    <canvas id="canvas-container" width=800 height=500></canvas>
</div>

Change the canvas buffer size.

<style type="text/css">
    #canvas-container{
        width: 800px;
        height: 500px;
        border: solid 2px;
    }
</style>
<div id="canvas-area">
    <canvas id="canvas-container" width=250 height=600></canvas>
</div>

[JavaScript] Drifting Effect

I created drifting animation for my friend’s website the other day.

GOAL

To create animation of drifting items.

Source Code

<style type="text/css">
    #canvas-area {
        width: 100%;
        height: 100%;
        position: relative;
    }
    #canvas-container{
        width: 1000px;
        height: 500px;
    }
</style>
<div id="canvas-area">
    <canvas id="canvas-container"></canvas>
</div>
<script type="text/javascript">
    //set canvas
    var canvasArea = document.querySelector('#canvas-area');
    var canvas = document.querySelector('#canvas-container');
    var ctx = canvas.getContext('2d');
    var canvas_width = canvas.width;
    var canvas_height = canvas.height;

    var last_time;

    //settings
    var item_num = 20;
    var img_src_array = ['img1.png', 'img2.png', 'img3.png', 'img4.png', 'img5.png'];
    var first_start_x = canvas_width - 100;
    var first_start_y = canvas_height - 100;

    //Item Object
    var Item = function(input_img){
        img_width = input_img.width;
        img_height = input_img.height;
        this.alpha = 1.0;
        this.img = input_img;
        this.start_x = first_start_x;
        this.start_y = first_start_y;
        this.x = this.start_x ;
        this.y = this.start_y;
        this.rotate = Math.random()*Math.PI*2;
        console.log(img.src)
        this.speed=[parseInt((Math.random())*10), parseInt(Math.random()+2)];
    };
    Item.prototype.update = function(){
        this.x -= this.speed[0];
        this.y -= this.speed[1];
        this.alpha *= 0.9;
        if(this.alpha < 0.1 ){
            this.alpha = 0;
        }
        
        if(this.x+this.img.width < 0 || this.x > canvas_width || this.y + this.img.height < 0){
            this.speed=[parseInt((Math.random())*10), parseInt(Math.random()+2)];
            console.log(`${this.start_x}:${this.start_y}`)
            this.x = this.start_x;
            this.y = this.start_y;
            this.rotate = Math.random()*Math.PI*2;
            this.alpha =1.0;
        }
    };
    Item.prototype.display = function(){
        ctx.globalAlpha = this.alpha;
        ctx.translate(this.x + img_width/2, this.y+ img_height/2);
        ctx.rotate(this.rotate);
        ctx.drawImage(this.img, -img_width/2, -img_height/2, img_width/2, img_height/2);
        ctx.rotate(-this.rotate);
        ctx.translate(-this.x - img_width/2, -this.y - img_height/2);
    };

    //create item array
    var items = [];
    var item_add = function(img){
        img.width = 100;
        img.height = 100;
        items.push(new Item(img));
        initialize();
    };

    for(var i=0; i<item_num; i++){
        img = new Image();
        img.src = img_src_array[parseInt(Math.random()*img_src_array.length)];
        img.onload = item_add(img);
    }

    function initialize(){
        if(items.length == item_num){
            last_time = new Date().getTime();
            animation();
        }
    }

    //animation
    function animation(){
        //callback
        window.requestAnimationFrame(animation);
        now_time =  new Date().getTime();
        //clear window
        if((now_time - last_time) > 100){
            last_time = now_time
            ctx.clearRect(0, 0, canvas_width, canvas_height);
            for(var i=0; i<item_num; i++){
                items[i].display();
                items[i].update();
            }
        }
    }
</script>

Item Object

Item Object has local variables.

alphaalpha channel value of this Item
imgHTMLImageElement of this Item
start_x, start_ythe position where this Item appears
x, ythe position where this Item exists
rotatethe rotation angle of this Item
speedthe moving speed of this Item
    //Item Object
    var Item = function(input_img){
        img_width = input_img.width;
        img_height = input_img.height;
        this.alpha = 1.0;
        this.img = input_img;
        this.start_x = first_start_x;
        this.start_y = first_start_y;
        this.x = this.start_x ;
        this.y = this.start_y;
        this.rotate = Math.random()*Math.PI*2;
        this.speed=[parseInt((Math.random())*10), parseInt(Math.random()+2)];
    };

Item Object has 2 functions.

update()update position and alpha channel
display()Rotation and movement by coordinate transformation
translate->rotate->draw->rotate(reverse)->translate(reverse)
    Item.prototype.update = function(){
        this.x -= this.speed[0];
        this.y -= this.speed[1];
        this.alpha *= 0.9;
        if(this.alpha < 0.1 ){
            this.alpha = 0;
        }
        
        if(this.x + this.img.width < 0 || this.x > canvas_width || this.y + this.img.height < 0){
            this.speed=[parseInt((Math.random())*10), parseInt(Math.random()+2)];
            console.log(`${this.start_x}:${this.start_y}`)
            this.x = this.start_x;
            this.y = this.start_y;
            this.rotate = Math.random()*Math.PI*2;
            this.alpha =1.0;
        }
    };
    Item.prototype.display = function(){
        ctx.globalAlpha = this.alpha;
        ctx.translate(this.x + img_width/2, this.y+ img_height/2);
        ctx.rotate(this.rotate);
        ctx.drawImage(this.img, -img_width/2, -img_height/2, img_width/2, img_height/2);
        ctx.rotate(-this.rotate);
        ctx.translate(-this.x - img_width/2, -this.y - img_height/2);
    };

Create Item instances

Each image is assigned to the Item object randomly.

for(var i=0; i<item_num; i++){
        img = new Image();
        img.src = img_src_array[parseInt(Math.random()*img_src_array.length)];
        img.onload = item_add(img);
    }

Animation function

Update() and display() each Items at regular intervals.

    //animation
    function animation(){
        //callback
        window.requestAnimationFrame(animation);
        now_time =  new Date().getTime();
        //clear window
        if((now_time - last_time) > 100){
            last_time = now_time
            ctx.clearRect(0, 0, canvas_width, canvas_height);
            for(var i=0; i<item_num; i++){
                items[i].display();
                items[i].update();
            }
        }
    }

[Blender] Warning: class CLASS_NAME contains a property which should be an annotation!

Warning Detail

When I install my custom addon in Blender2.80, the warning “class CLASS_NAME contains a property which should be an annotation!” occured. the class CLASS_NAME is an operator class that inherits bpy.types.Operator. And the class contains bpy.props properties as below.

class MY_OT_import_file(bpy.types.Operator):
    bl_idname = "my.import_file"
    bl_label = "My Import file"
    bl_description = "Custom import addon"
    bl_options = {'REGISTER', 'UNDO'}
    
    filepath = bpy.props.StringProperty(default="",subtype="FILE_PATH")
    
    def execute(self, context):
        ...

Cause

Reference: Blender 2.80: Addon API

Classes that contain properties from bpy.props now use Python’s type annotations (see PEP 526) and should be assigned using a single colon : in Blender 2.8x instead of equals = as was done in 2.7x

from Blender 2.80: Addon API

Correction

Use annotation in the class where warning occurred to set properties.

class MY_OT_import_file(bpy.types.Operator):
    bl_idname = "my.import_file"
    bl_label = "My Import file"
    bl_description = "Custom import addon"
    bl_options = {'REGISTER', 'UNDO'}
    
    filepath : bpy.props.StringProperty(default="",subtype="FILE_PATH")
    
    def execute(self, context):
        ...

Unpaired One-way ANOVA And Multiple Comparisons In Python

GOAL

To write program of unpaired one-way ANOVA(analysis of variance) and multiple comparisons using python. Please refer another article “Paired One-way ANOVA And Multiple Comparisons In Python” for paired one-way ANOVA.

What is ANOVA?

ANOVE is is a method of statistical hypothesis testing that determines the effects of factors and interactions, which analyzes the differences between group means within a sample.
Details will be longer. Please see the following site.

One-way ANOVA is ANOVA test that compares the means of three or more samples. Null hypothesis is that samples in groups were taken from populations with the same mean.

Implementation

The following is implementation example of one-way ANOVA.

Import Libraries

Import libraries below for ANOVA test.

import pandas as pd
import numpy as np
import scipy as sp
import csv # when you need to read csv data
from scipy import stats as st

import statsmodels.formula.api as smf
import statsmodels.api as sm
import statsmodels.stats.anova as anova #for ANOVA
from statsmodels.stats.multicomp import pairwise_tukeyhsd #for Tukey's multiple comparisons

Data Preparing

group A85908869789887
group B55826764785449
group C46955980527370

test_data.csv

85, 90, 88, 69, 78, 98, 87
55, 82, 67, 64, 78, 54, 49
46, 95, 59, 80, 52, 73, 70

Read and Set Data

csv_line = []
with open('test_data.csv', ) as f:
    for i in f:
        items = i.split(',')
        for j in range(len(items)):
            if '\n' in items[j]:
                items[j] =float(items[j][:-1])
            else:
                items[j] =float(items[j])
        print(items)
        csv_line.append(items)
groupA = csv_line [0]
groupB = csv_line [1]
groupC = csv_line [2]

tdata = pd.DataFrame({'A':groupA, 'B':groupB, 'C':groupC})
tdata.index = range(1,10)
tdata 

If you want to display data summary, use DataFrame.describe().

tdata.describe()

ANOVA

f, p = st.f_oneway(tdata['A'],tdata['B'],tdata['C'])
print("F=%f, p-value = %f"%(f,p))

>> F=4.920498, p-value = 0.019737

The smaller the p-value, the stronger the evidence that you should reject the null hypothesis.
When statistically significant, that is, p-value is less than 0.05 (typically ≤ 0.05), perform a multiple comparison.

Tukey’s multiple comparisons

Use pairwise_tukeyhsd(endog, groups, alpha=0.05) for tuky’s HSD(honestly significant difference) test. Argument endog is response variable, array of data (A[0] A[1]… A[6] B[1] … B[6] C[1] … C[6]). Argument groups is list of names(A, A…A, B…B, C…C) that corresponds to response variable. Alpha is significance level.

def tukey_hsd(group_names , *args ):
    endog = np.hstack(args)
    groups_list = []
    for i in range(len(args)):
        for j in range(len(args[i])):
            groups_list.append(group_names[i])
    groups = np.array(groups_list)
    res = pairwise_tukeyhsd(endog, groups)
    print (res.pvalues) #print only p-value
    print(res) #print result
print(tukey_hsd(['A', 'B', 'C'], tdata['A'], tdata['B'],tdata['C']))
>>[0.02259466 0.06511251 0.85313142]
 Multiple Comparison of Means - Tukey HSD, FWER=0.05 
=====================================================
group1 group2 meandiff p-adj   lower    upper  reject
-----------------------------------------------------
     A      B -20.8571 0.0226 -38.9533 -2.7609   True
     A      C -17.1429 0.0651 -35.2391  0.9533  False
     B      C   3.7143 0.8531 -14.3819 21.8105  False
-----------------------------------------------------
None

Supplement

If you can’t find ‘pvalue’ key, check the version of statsmodels.

import statsmodels
statsmodels.__version__
>> 0.9.0

If the version is lower than 0.10.0, update statsmodels. Open command prompt or terminal and input the command below.

pip install --upgrade statsmodels
# or pip3 install --upgrade statsmodels

Memorandum of Shadertoy Learning. part1

I’m trying shadertoy these days. This is my tutorial for shadertoy.

1 main function

void mainImage( out vec4 fragColor, in vec2 fragCoord ) is the entry point in Shadertoy.

void mainImage( out vec4 fragColor, in vec2 fragCoord )
{
 //main drawing process is here
}

Variable fragCoord contains the pixel coordinates for which the shader needs to compute a color. The resulting color is gathered in fragColor as a four component vector

Modifiers

  • in
    • an “in” variable is used only in this function and not output.
  • out
    • an “out” variable is an output variable that can be passed by reference.
  • inout
    • an “inout” variable is an output and input variable.

2 fragColor

void mainImage( out vec4 fragColor, in vec2 fragCoord )
{
fragColor = vec4(0.98, 0.808, 0.333, 1.0);
}

Assign vec4 (R, G, B, alpha) to fragColor variable.

3 fragCoord

variable fragCoord is coordinate of target pixel. fragCoord.x is x coordinate and fragCoord.y is y coordinate and fragCoord.xy is (x,y) coordinate.

void mainImage( out vec4 fragColor, in vec2 fragCoord )
{
    vec3 color1 = vec3(1.0, 1.0, 0.5);
    vec3 color2 = vec3(0.98, 0.808, 0.333);
    if (int(fragCoord.x )% 50 < 25){
        fragColor = vec4(color1, 1.0);
    }
    else{
        fragColor = vec4(color2, 1.0);
    }
}

4 iResolution

Uniform variable iResolution passes the resolution of the image to the shader. iResolution.x is x coordinate and iResolution.y is y coordinate and iResolution.xy is (x,y) coordinate.

void mainImage( out vec4 fragColor, in vec2 fragCoord )
{
    int n = 4;
    int width = int(iResolution.x)/n;
    if (int(fragCoord.x )% width < width/2){
        fragColor = vec4(1.0, 1.0, 1.0-fragCoord.y/iResolution.y, 1.0);
    }
    else{
        fragColor = vec4(1.0, 0.0, fragCoord.y/iResolution.y, 1.0);
    }
}

5 Conditional branch and color setting

Check the article “How to Convert HSV to RGB” for more information about hsv2rgb.

vec3 hsv2rgb(in vec3 hsv){
    vec3 rgb;
    float h = hsv.x * 360.0;
    float s = hsv.y;
    float v = hsv.z;
    float c =v * s;
    float h2 = h/60.0;
    float x = c*(1.0 - abs( mod(h2, 2.0) - 1.0));
    switch(int(h2)){
        case 0: rgb = vec3(v-c) + vec3(c, x, 0.0); return rgb;
        case 1: rgb = vec3(v-c) + vec3(x, c, 0.0); return rgb;
        case 2: rgb = vec3(v-c) + vec3(0.0, c, x); return rgb;
        case 3: rgb = vec3(v-c) + vec3(0.0, x, c); return rgb;
        case 4: rgb = vec3(v-c) + vec3(x, 0.0, c); return rgb;
        case 5: rgb = vec3(v-c) + vec3(c, 0.0, x); return rgb;
        case 6: rgb = vec3(v-c) + vec3(c, x, 0.0); return rgb;
    }
}

void mainImage( out vec4 fragColor, in vec2 fragCoord )
{
    vec2 coordinate =  fragCoord.xy - 0.5*iResolution.xy;
    vec3 pixel_color = vec3(0.5);
    
    int gradation = 10;
    
    int r_width = int(0.5*iResolution.y/float(gradation));
    int r;
    for(int i =0; i<gradation+1; i++){
        r = r_width*i;
        float i_flaot = float(float(i)/float(gradation+1));
        if(coordinate.x*coordinate.x + coordinate.y*coordinate.y < float(r*r)){
        	pixel_color = hsv2rgb(vec3((1.0/float(gradation))*float(i), 1.0, 1.0));
            break;
    	}
    }
    fragColor = vec4(pixel_color, 1.0);
}

Chi-Square Test in R

This article is just a little note on R.

GOAL

To do chi-square test and residual analysis in R. If you want to know chi-square test and implement it in python, refer “Chi-Square Test in Python”.

Source Code

> test_data <- data.frame(
  groups = c("A","A", "B", "B", "C", "C"),
  result = c("success", "failure", "success", "failure", "success", 
 "failure"),
  number = c(23, 100, 65, 44, 158, 119)
)

> test_data
groups  result number
1      A success     23
2      A failure    100
3      B success     65
4      B failure     44
5      C success    158
6      C failure    119

> cross_data <- xtabs(number ~ ., test_data)
> cross_data
      result
groups failure success
     A     100      23
     B      44      65
     C     119     158

> result <- chisq.test(cross_data, correct=F)
> result
	Pearson's Chi-squared test

data:  cross_data
X-squared = 57.236, df = 2, p-value = 3.727e-13

> reesult$residuals
      result
groups   failure   success
     A  4.571703 -4.727030
     B -1.641673  1.697450
     C -2.016609  2.085125

> result$stdres
      result
groups   failure   success
     A  7.551524 -7.551524
     B -2.663833  2.663833
     C -4.296630  4.296630

> pnorm(abs(result$stdres), lower.tail = FALSE) * 2
      result
groups      failure      success
     A 4.301958e-14 4.301958e-14
     B 7.725587e-03 7.725587e-03
     C 1.734143e-05 1.734143e-05

functions

xtabs

xtabs() function is a function to create a contingency table from cross-classifying factors that contained in a data frame. “~” is the formula to specify variables that serve as aggregation criteria are described. And “~ .” means that this function use all variables (groups+result).

chisq.test

chisq.test() function is a function to return the test statistic, degree of freedom and p-value. The argument “correct” is continuity correction and set “correct” into F to suppress the continuity correction.

reesult$residuals

$residuals return standardized residuals.

result$stdres

$stdres return adjusted standardized residuals.

pnorm(abs(result$stdres), lower.tail = FALSE) * 2

This calculates p-value of standardized residuals.

What is @classmethod in python

GOAL

To understand what @classmethod in python is and how to use it

What is classmethod?

@classmethod is a function decorator.

class C:
    @classmethod
    def f(cls, arg1, arg2, ...):

A class method can be called either on the class (such as C.f()) or on an instance (such as C().f()). The instance is ignored except for its class. If a class method is called for a derived class, the derived class object is passed as the implied first argument.

Python document >library >fuction

Features of class methods

  • class methods can be called as the form Classname.method_name() without generate instance.
  • class methods receive ‘cls’ not ‘self’ as argument.

How to use

Functions that access the internal data of the class can be managed collectively with class itself.

class Student:
    def __init__(self, name, grade):
        self.name = name
        self.grade = grade

    @classmethod
    def testpoint_to_grade(cls, name, testpoint):
        if testpoint > 90:
            return cls(name, 'A')
        elif testpoint > 80:
            return cls(name, 'B')
        elif testpoint > 60:
            return cls(name, 'C')
        else:
            return cls(name, 'D')

    def print_grade(self):
        print(self.grade) 

student1 = Student('Alice', 'C')
student2 = Student.testpoint_to_grade('Ben', 85)

student1.print_grade()
>> C
student2.print_grade()
>> B