Unpaired One-way ANOVA And Multiple Comparisons In Python
GOAL
To write program of unpaired one-way ANOVA(analysis of variance) and multiple comparisons using python. Please refer another article “Paired One-way ANOVA And Multiple Comparisons In Python” for paired one-way ANOVA.
What is ANOVA?
ANOVE is is a method of statistical hypothesis testing that determines the effects of factors and interactions, which analyzes the differences between group means within a sample.
Details will be longer. Please see the following site.
- Explainer video on Youtube
- A Simple Introduction to ANOVA (Analyticsvidhya)
- Analysis of Variance (Online Statistics Education)
One-way ANOVA is ANOVA test that compares the means of three or more samples. Null hypothesis is that samples in groups were taken from populations with the same mean.
Implementation
The following is implementation example of one-way ANOVA.
Import Libraries
Import libraries below for ANOVA test.
import pandas as pd
import numpy as np
import scipy as sp
import csv # when you need to read csv data
from scipy import stats as st

import statsmodels.formula.api as smf
import statsmodels.api as sm
import statsmodels.stats.anova as anova #for ANOVA
from statsmodels.stats.multicomp import pairwise_tukeyhsd #for Tukey's multiple comparisons
Data Preparing
| group A | 85 | 90 | 88 | 69 | 78 | 98 | 87 |
| group B | 55 | 82 | 67 | 64 | 78 | 54 | 49 |
| group C | 46 | 95 | 59 | 80 | 52 | 73 | 70 |
test_data.csv
85, 90, 88, 69, 78, 98, 87
55, 82, 67, 64, 78, 54, 49
46, 95, 59, 80, 52, 73, 70
Read and Set Data
csv_line = []
with open('test_data.csv', ) as f:
    for i in f:
        items = i.split(',')
        for j in range(len(items)):
            if '\n' in items[j]:
                items[j] =float(items[j][:-1])
            else:
                items[j] =float(items[j])
        print(items)
        csv_line.append(items)
groupA = csv_line [0]
groupB = csv_line [1]
groupC = csv_line [2]
tdata = pd.DataFrame({'A':groupA, 'B':groupB, 'C':groupC})
tdata.index = range(1,10)
tdata 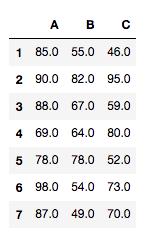
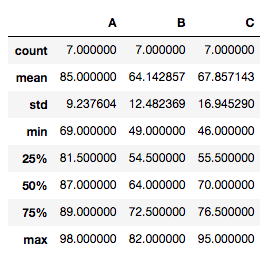
If you want to display data summary, use DataFrame.describe().
tdata.describe()
ANOVA
f, p = st.f_oneway(tdata['A'],tdata['B'],tdata['C'])
print("F=%f, p-value = %f"%(f,p))

>> F=4.920498, p-value = 0.019737
The smaller the p-value, the stronger the evidence that you should reject the null hypothesis.
When statistically significant, that is, p-value is less than 0.05 (typically ≤ 0.05), perform a multiple comparison.
Tukey’s multiple comparisons
Use pairwise_tukeyhsd(endog, groups, alpha=0.05) for tuky’s HSD(honestly significant difference) test. Argument endog is response variable, array of data (A[0] A[1]… A[6] B[1] … B[6] C[1] … C[6]). Argument groups is list of names(A, A…A, B…B, C…C) that corresponds to response variable. Alpha is significance level.
def tukey_hsd(group_names , *args ):
    endog = np.hstack(args)
    groups_list = []
    for i in range(len(args)):
        for j in range(len(args[i])):
            groups_list.append(group_names[i])
    groups = np.array(groups_list)
    res = pairwise_tukeyhsd(endog, groups)
    print (res.pvalues) #print only p-value
    print(res) #print result
print(tukey_hsd(['A', 'B', 'C'], tdata['A'], tdata['B'],tdata['C']))
>>[0.02259466 0.06511251 0.85313142]
Multiple Comparison of Means - Tukey HSD, FWER=0.05
=====================================================
group1 group2 meandiff p-adj lower upper reject
-----------------------------------------------------
A B -20.8571 0.0226 -38.9533 -2.7609 True
A C -17.1429 0.0651 -35.2391 0.9533 False
B C 3.7143 0.8531 -14.3819 21.8105 False
-----------------------------------------------------
NoneSupplement
If you can’t find ‘pvalue’ key, check the version of statsmodels.
import statsmodels
statsmodels.__version__
>> 0.9.0
If the version is lower than 0.10.0, update statsmodels. Open command prompt or terminal and input the command below.
pip install --upgrade statsmodels
# or pip3 install --upgrade statsmodels