WARN (bpy.rna): c:\b\win64_cmake_vs2017\win64_cmake_vs2017\blender.git\source\blender\python\intern\bpy_rna.c:1476 pyrna_enum_to_py: current value ‘3’ matches no enum in ‘SpaceNodeEditor’, ‘(null)’, ‘tree_type’
There’s also a corner case when having the Shader editor visible (for example when Cycles is active) and then switching to a render engine that has bl_use_shading_nodes_custom=True: the icon for the editor will become blank, but the Shader editor remains visible. In the console I warnings in this case: WARN (bpy.rna): ../source/blender/python/intern/bpy_rna.c:1451 pyrna_enum_to_py: current value ‘3’ matches no enum in ‘SpaceNodeEditor’, ‘(null)’, ‘tree_type’
When I activate my custom render engine and switch to the Shading workspace, the node menus disappear and I get the error: WARN (bpy.rna): c:\b\win64_cmake_vs2017\win64_cmake_vs2017\blender.git\source\blender\python\intern\bpy_rna.c:1449 pyrna_enum_to_py: current value ‘0’ matches no enumin ‘SpaceNodeEditor’, ‘(null)’, ‘tree_type’
The cause is unclear. However, in my case, this error occurs when I access SpaceNodeEditor.tree_type in register() function with the flag “bl_use_shading_nodes_custom” set to True. My solution was one of the following:
To set SpaceNodeEditor.tree_type not to be accessed in register() function.
Set the flag “bl_use_shading_nodes_custom to False and use my node in ShaderEditor for existing Eevee, Cycles.
Chi-square test which means “Pearson’s chi-square test” here, is a method of statistical hypothesis testing for goodness-of-fit and independence.
Goodness-of-fit test is the testing to determine whether the observed frequency distribution is the same as the theoretical distribution. Independence test is the testing to determine whether 2 observations that is represented by 2*2 table, on 2 variables are independent of each other.
Details will be longer. Please see the following sites and document.
The following is implementation for chi-square test.
Import libraries
import numpy as np
import pandas as pd
import scipy as sp
from scipy import stats
Data preparing
gourp A
group B
group C
success
23
65
158
failure
100
44
119
success rate
0.187
0.596
0.570
chi_square_data.csv
A,B,C
23,65,158
100,44,119
Read and Set Data
csv_line = []
with open('chi_square_data.csv', ) as f:
    for i in f:
        items = i.split(',')
        for j in range(len(items)):
            if '\n' in items[j]:
                items[j] =float(items[j][:-1])
            else:
                items[j] =float(items[j])
        csv_line.append(items)
group = csv_line[0]
success = [int(n) for n in csv_line[1]]
failure = [int(n) for n in csv_line[2]]

groups = []
result =[]
count = []
for i in range(len(group)):
    groups += [group[i], group[i]] #['A','A', 'B', 'B', 'C', 'C']
    result += ['success', 'failure'] #['success', 'failure', 'success', 'failure', 'success', 'failure']
    count += [success[i], failure[i]] #[23, 100, 65, 44, 158, 119]

data =  pd.DataFrame({
    'groups' : groups,
    'result' : result,
    'count' : count
})
cross_data = pd.pivot_table(
    data = data,
    values ='count',
    aggfunc = 'sum',
    index = 'groups',
    columns = 'result'
)
print(cross_data)
>>result  failure  success
groups
A           100       23
B            44       65
C           119      158
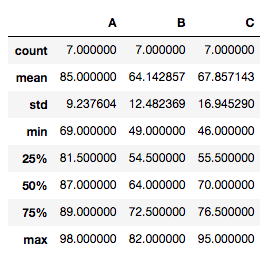
The expected frequencies, based on the marginal sums of the table.
The smaller the p-value, the stronger the evidence that you should reject the null hypothesis. When statistically significant, that is, p-value is less than 0.05 (typically ≤ 0.05), the difference between groups is significant.
ANOVA(analysis of variance) is a method of statistical hypothesis testing that determines the effects of factors and interactions, which analyzes the differences between group means within a sample. Details will be longer. Please see the following site.
One-way ANOVA is ANOVA test that compares the means of three or more samples. Null hypothesis is that samples in groups were taken from populations with the same mean.
Implementation
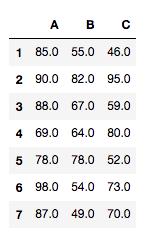
The following is implementation example of paired one-way ANOVA.
Import Libraries
Import libraries below for ANOVA test.
import statsmodels.api as sm
from statsmodels.formula.api import ols
import pandas as pd
import numpy as np
import statsmodels.stats.anova as anova
csv_line = []
with open('test_data.csv', ) as f:
    for i in f:
        items = i.split(',')
        for j in range(len(items)):
            if '\n' in items[j]:
                items[j] =float(items[j][:-1])
            else:
                items[j] =float(items[j])
        print(items)
        csv_line.append(items)
aov=anova.AnovaRM(df, 'Point','Subjects',['Conditions'])
result=aov.fit()

print(result)

>>                 Anova
========================================
           F Value Num DF  Den DF Pr > F
----------------------------------------
Conditions  5.4182 2.0000 12.0000 0.0211
========================================
The smaller the p-value, the stronger the evidence that you should reject the null hypothesis. When statistically significant, that is, p-value is less than 0.05 (typically ≤ 0.05), perform a multiple comparison. This p value is different between paired ANOVA and unpaired ANOVA.
Tukey’s multiple comparisons
Use pairwise_tukeyhsd(endog, groups, alpha=0.05) for tuky’s HSD(honestly significant difference) test. Argument endog is response variable, array of data (A[0] A[1]… A[6] B[1] … B[6] C[1] … C[6]). Argument groups is list of names(A, A…A, B…B, C…C) that corresponds to response variable. Alpha is significance level.
def tukey_hsd(group_names , *args ):
    endog = np.hstack(args)
    groups_list = []
    for i in range(len(args)):
        for j in range(len(args[i])):
            groups_list.append(group_names[i])
    groups = np.array(groups_list)
    res = pairwise_tukeyhsd(endog, groups)
    print (res.pvalues) #print only p-value
    print(res) #print result
print(tukey_hsd(['A', 'B', 'C'], tdata['A'], tdata['B'],tdata['C']))
>> [0.02259466 0.06511251 0.85313142]
 Multiple Comparison of Means - Tukey HSD, FWER=0.05
=====================================================
group1 group2 meandiff p-adj   lower    upper  reject
-----------------------------------------------------
     A      B -20.8571 0.0226 -38.9533 -2.7609   True
     A      C -17.1429 0.0651 -35.2391  0.9533  False
     B      C   3.7143 0.8531 -14.3819 21.8105  False
-----------------------------------------------------
None
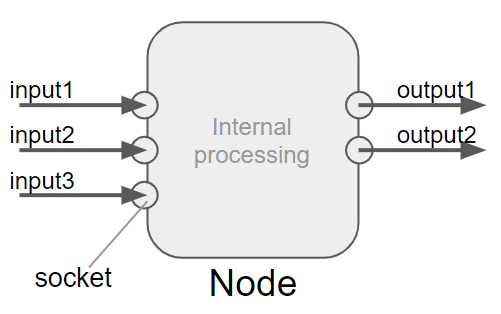
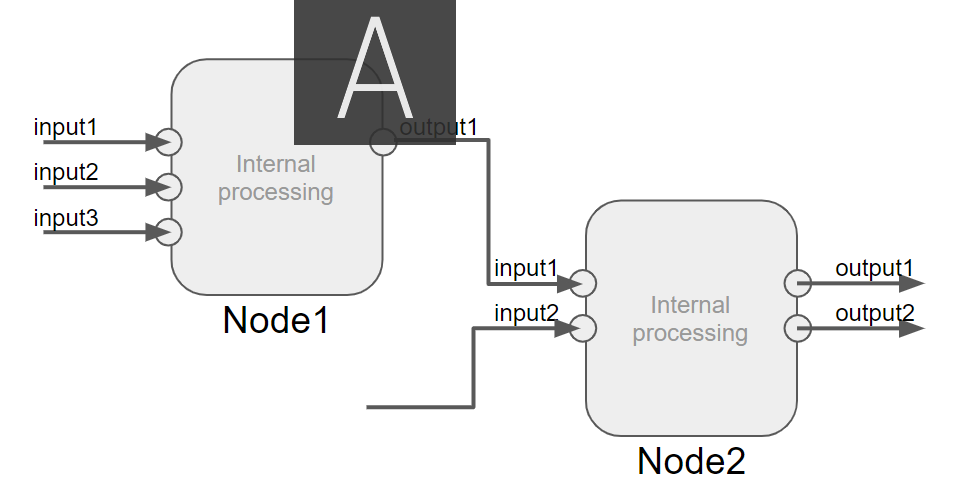
Node Tree is the whole structure consists of connected nodes.
Node type in Blender
There are three types of node trees and node editor in Blender, Shade Nodes, Composite Nodes and Texture Nodes. Please refer to Blender 2.80 Manual “Introduction” for detail.
Shader Nodes
Materials, lights and backgrounds are all defined using a network of shading nodes. These nodes output values, vectors, colors and shaders.
Compositing Nodes allow you to assemble and enhance an image (or movie). Using composition nodes, you can glue two pieces of footage together and colorize the whole sequence all at once.You can enhance the colors of a single image or an entire movie clip in a static manner or in a dynamic way that changes over time (as the clip progresses).
Blender includes a node-based texture generation system, which enables textures creation by combining colors, patterns and other textures in the same way as shader writing with material nodes.
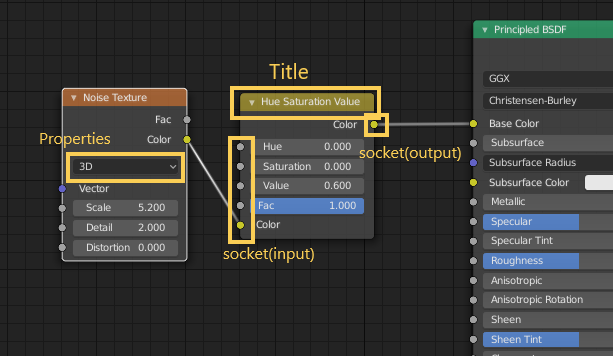
You can manipulate Nodes and create node network with different types of node editors. The basic operation method of node editor is here.
NodeTree in PythonAPI
The word “NodeTree” is also used in Blender PythonAPI( https://docs.blender.org/api/current/bpy.types.NodeTree.html ). bpy.types.NodeTree(ID) class, which has nodes attribute and links attribute, can get NodeTree specified by the ID. Nodes is bpy_prop_collection of nodesthat make up the node tree. Links is bpy_prop_collection of links to connect the nodes.
Return the value of the named attribute of object. name must be a string. If the string is the name of one of the object’s attributes, the result is the value of that attribute. For example, getattr(x, 'foobar') is equivalent to x.foobar. If the named attribute does not exist, default is returned if provided, otherwise AttributeError is raised.
Color manager (also called “color management system” or “management solution”) is an application to change the color space of image and video.
In VFX production, many color spaces are used according to the tools such as digital cinema camera, rendered CG, photos and matte paint. it is necessary to unify or convert the color space. Color space conversion is an important process in VFX production.
What is color space?
Color space is a specific organization of colors in which colors are represented as coordinates.
Color model
Color model is an abstract mathematical model describing colors with some channels ( e.g. RGB, CMYK). Although color model is not the same thing as color space, some color system such as Adobe RGB and sRGB are based on color model.
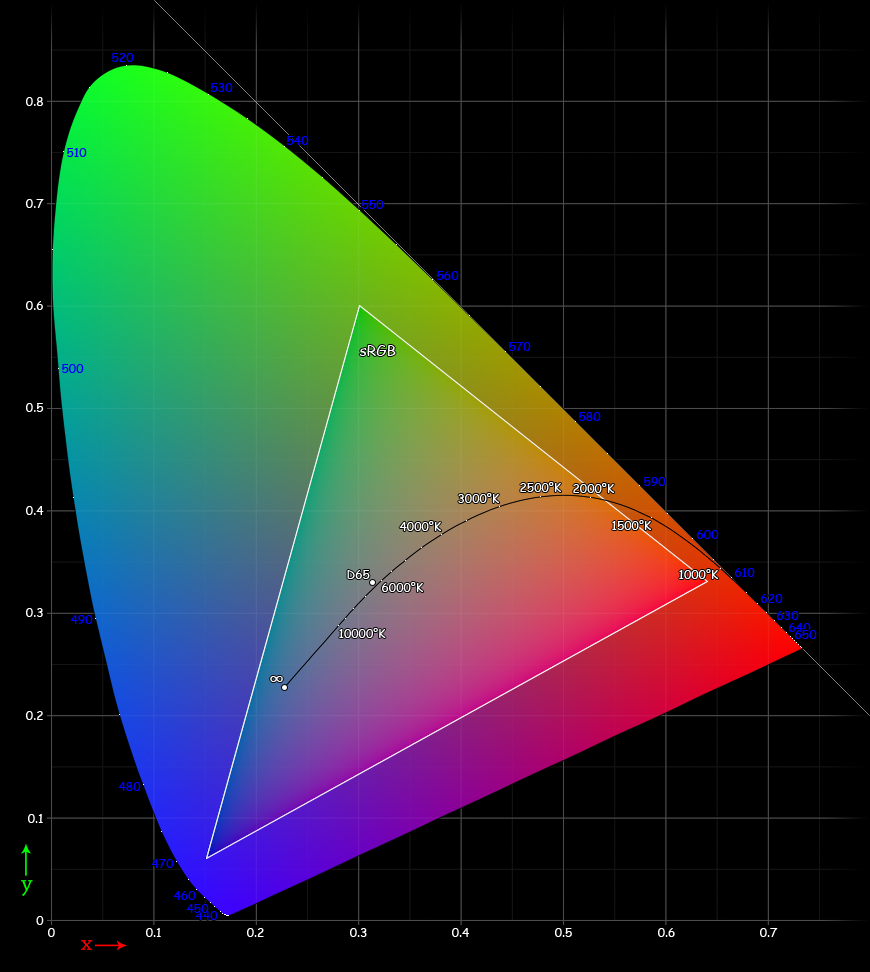
sRGB (standard Red Green Blue) is an RGB color space to use mainly on monitors, printers, and the Internet. The color gamut that can be represented in this method is the color triangle defined by three primary colors, Red, Green and Blue.
CIE 1931 xy chromaticity diagram showing the gamut of the sRGB color space and location of the primaries.( CC BY-SA 3.0) * This image is colored in sRGB space, so the colors outside of the triangle are interpolated.
Adobe RGB
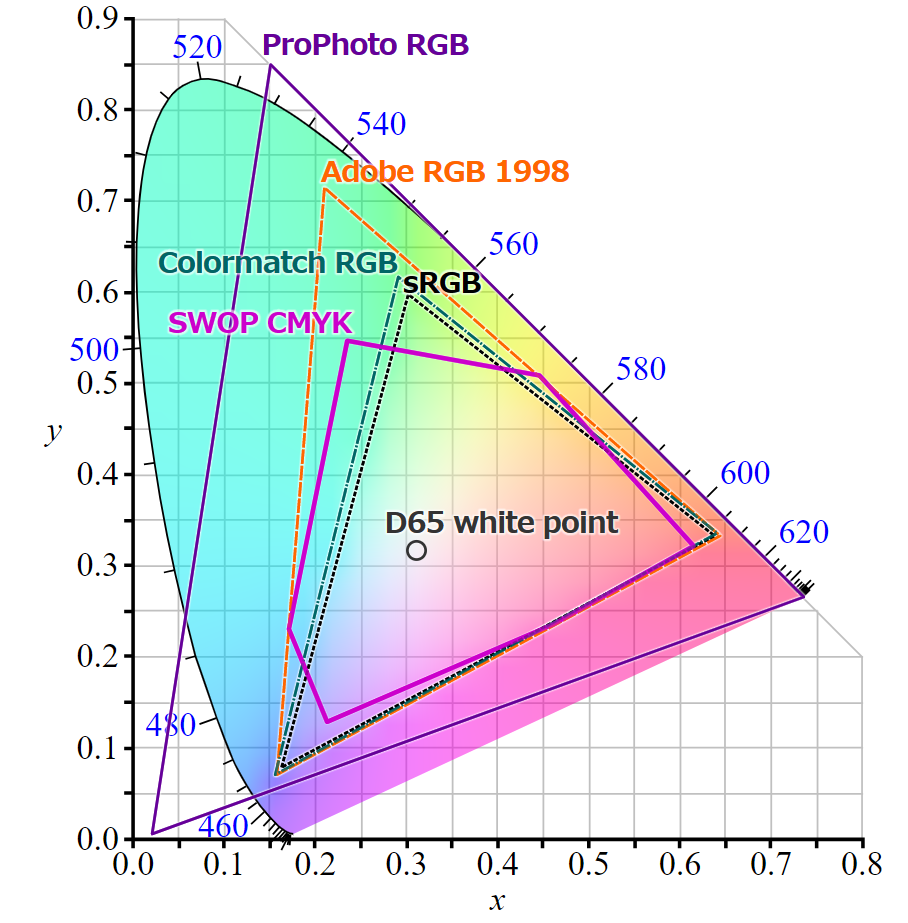
Adobe RGB is a color space definition proposed by Adobe Systems. It has a wider RGB color reproduction range than sRGB (especially green), designed to cover most of the colors achievable with CMYK color printers. It encompasses about 50% of the visible colors specified in the CIELAB color space.
The CIE 1931 xy chromaticity diagram showing the primaries of the Adobe RGB (1998) color space. The CIE Standard Illuminant D65 white point is shown in the center.( CC BY-SA 3.0)
NTSC (BT.601)
NTSC Color Space is designed for television. It features a color gamut that is much wider than sRGB.While NTSC is not used in modern displays, it is commonly used to compare and specify color gamut. This is also one of the major television formats in the world including PAL, SECAM.
Rec.2020
ITU-R Recommendation BT.2020 aka Rec.2020 or BT.2020 defines various aspects of ultra-high-definition television (UHDTV) with standard dynamic range (SDR) and wide color gamut (WCG). It defines picture resolutions, frame rates with progressive scan, bit depths, color primaries, RGB and luma-chroma color representations, chroma subsamplings, and an opto-electronic transfer function. full HD and HDR are not supported.
Rec.2100
Rec.2100 is upward compatible with Rec.2020. ITU-R Recommendation BT.2100 aka Rec.2100 or BT.2100 is an international standard for specifications that must be met by devices that handle full HD(2K), 4K and 8K resolutions. It was established by the International Telecommunication Union Wireless Communication Sector (ITU-R).
CMYK(or just CMY)
CMYK uses subtractive color mixing used in the printing process. CMYK corresponds to Ink colors, Cyan, Magenta, Yellow and Black.
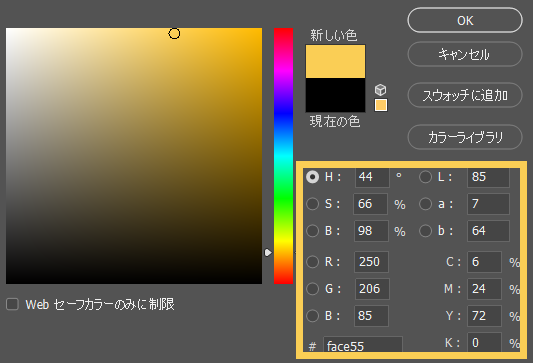
HSV
HSV(Hue, Saturation, Value) is used for painting or color sample on computers. Painting artists use it because it is more natural and intuitive to consider colors in terms of hue, color and saturation than additive mixing or subtractive mixing. HSV is a transformation of an RGB color space. HSV is also called HSB (hue, saturation, brightness).
HSL
HSL (hue, saturation, lightness / luminance) is quite similar to HSV, with “lightness” replacing “brightness”. The difference is a value calculation method. HSV uses a hexagonal pyramid model in which the brightness of pure color is equal to the brightness of white, while HLS uses a bi-hexagonal pyramid model in which the brightness of pure color is 50% of the brightness of white.(Please refer this image). It is also called HSI (hue, saturation, intensity).
LMS
LMS color place is based on three kinds of cone cells that human eye with normal vision has. These cone cells sense light and have peaks of spectral sensitivity in Short wavelength, Middle wavelength and Long wavelength. The three parameters corresponding to levels of stimulus of the three kinds of cone cells(L, M, S) describe any human color sensation. So LMS color space can contain all visible colors. However LMS is not objective representation of colors because parameters L, M and S is different between people and emvironment.
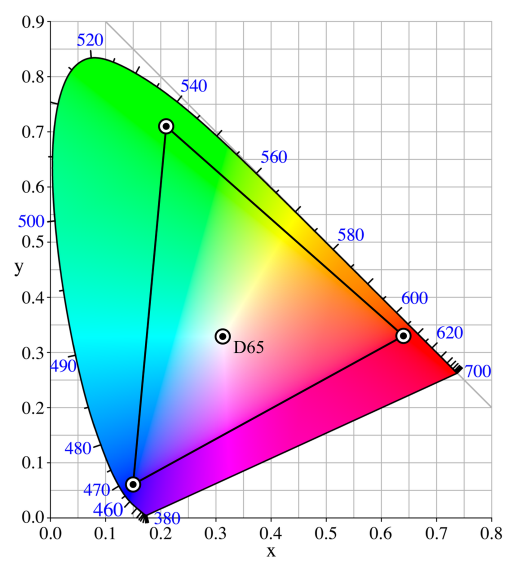
CIE 1931 color spaces
CIE (Commission internationale de l’éclairage, the International Commission on Illumination) is the organization that creates international standards related to light and color. CIE 1931 color spaces is the first defined quantitative relations between distributions of wavelengths in the electromagnetic visible spectrum, and physiologically perceived colors.
The CIE XYZ is remap of the color space in which the tristimulus values are conceptualized as amounts of three primary colors.These primary colors are unvisible for human. The CIE XYZ color space is designed so that Y component corresponds to luminance. CIE XYZ can contain all visible colors.While RGB can’t represent some of visible colors without using negative value, CIE XYZ can contain all visible colors in positive quadrant.
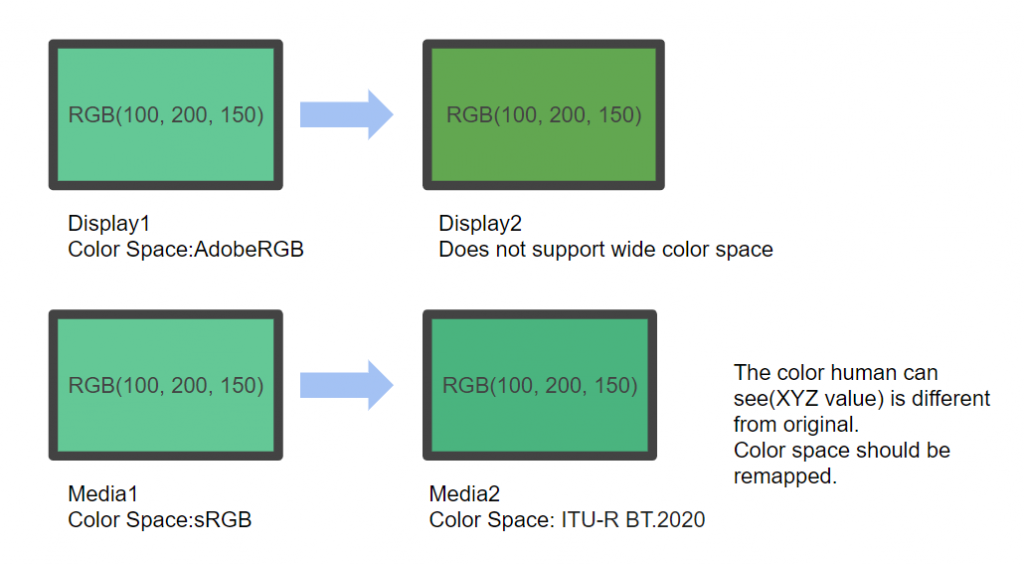
When you transfer exported video to another media, color gamut remapping, gamma correction, setting of white chromaticity (white point) are required and so on.
What is ACES?
ACES(Academy Color Encoding System) is a color image encoding system created under the auspices of the Academy of Motion Picture Arts and Sciences. The system defines its own primary color that encompass the visible spectral locus as defined by the CIE xyY specification.
When you use ACES in Video editing software such as Adobe AfterEffects , Maya and Nuke, color manager is needed. Color manager is usually provided as a plugin or built-in function.
Representative Color manager
OpenColorIO
OpenColorIO (OCIO) is a complete color management solution geared towards motion picture production with an emphasis on visual effects and computer animation.
I summarized some events that will be held in 2020 related to Image processing, CG, VFX, AR, VR, Artificial Intelligence, Animation, Adobe, Creative, Movie and so on.
January
February
March
The VFX Festival
3/16-3/18
Southbank Centre, UK
annual celebration of visual effects, animation, games and motion graphics.
An error “Permission denied @ apply2files – /usr/local/share/ghostscript/9.23/Resource/CIDFSubst/Deng.ttf” occurred when I tried to update homebrew.
What is homebrew?
Homebrew is a package management system to install and update software for macOS. (Official link: https://brew.sh/index_en)
What is ghostscript?
Homebrew is a package management system to install and update software for macOS. (Official link: https://brew.sh/index_en) Ghostscript is invoked and started by other software including homebrew.
The Resource / CIDFSubst directory is a directory to store TrueType fonts (but there is no problem here).
Cause of the error
Because the error message says “Permission denied”, the current user does not have access. So it seems that homebrew cannot use the required files.
Solution
As an immediate solution, give access to the ghostscript directory with the following command. You will be prompted for a password.
